For payers, the cost of CAR-T therapy is driven by more than product price alone
Chimeric antigen receptor T-cell (CAR-T) therapies have transformed the treatment landscape for several hematologic malignancies and represent one of the most significant advances in modern oncology. From a payer perspective, though, CAR-T therapy comes with financial exposure that is not limited to the cost of the drug itself, making it a challenge to understand the total costs associated with this specialized treatment.
Wholesale acquisition cost (WAC) is the published list price of drugs, but that often does not match the amount paid for these therapies in the real world. Furthermore, the cost of the CAR-T therapy is only one component of the total episode of care. Leukapheresis, inpatient admissions, administration, intensive monitoring, management of treatment-related complications, and post-infusion follow-up collectively contribute to the costs associated with the CAR-T therapy episode.1
In a prior Milliman white paper, we explored the unique uncertainties that cell and gene therapies introduce for payers and other risk-bearing stakeholders.2 That work highlighted a central challenge: High-cost therapies for rare diseases create financial exposure that is difficult to forecast using traditional budgeting approaches. Utilization is episodic rather than continuous, eligible patient populations are difficult to identify, and the total cost of care varies substantially from one patient to the next. As a result, even sophisticated forecasting models may struggle to accurately estimate real-world financial risk.
This analysis builds on the previous work by examining recent real-world commercial claims experience for CAR-T therapies, including observed CAR-T therapy and episode costs, and comparing treatment costs to WAC-based benchmarks. Understanding this variation is increasingly important for plan sponsors and insurers responsible for managing catastrophic healthcare expenditures.
Analyzing CAR-T product and episodic costs for commercially insured members
To better understand the financial exposure associated with CAR-T therapy, we conducted a retrospective claims analysis of commercially insured patients receiving CAR-T therapy using Milliman’s Consolidated Health Cost Guidelines Source Database (CHSD). Patients were identified using medical claims containing CAR-T-specific procedure codes during the study period, January 2022 through April 2025. The index date was defined as the service date of the CAR-T therapy claim or line item.
Allowed costs were analyzed for the CAR-T therapies (“product costs”) and for the time period surrounding the CAR-T therapy administration (“episode costs”). Claims contributing to the product cost analysis only reflected claims for which the CAR-T-specific costs could be identified with reasonable certainty; claims with a case rate or where costs were evenly spread across all inpatient claim line items did not contribute to the CAR-T product cost exhibits.
Consistent with another previous Milliman study,3 we defined the episode-of-care to include 60 days before the index date, the index date itself (including the cost of the therapy), and 60 days after the index date. This time range was selected because it generally includes the period of pretreatment and post-treatment procedures, monitoring, and potential adverse events for the cell therapies studied. It is probable that some costs included in the episode window were not related to the cell therapy and, alternately, that some treatment-related costs could fall outside the defined episode window.
Results were evaluated collectively for all in-market CAR-T therapies: Abecma, Breyanzi, Carvykti, Kymriah, Tecartus, and Yescarta. This approach intended to focus on commercial insurer experience associated with CAR-T therapy as a class, rather than on differences among individual products.
Analysis findings
In our dataset of approximately 65 million commercially insured lives, 1,278 CAR-T treatment episodes were identified. There were 469 female (37%) and 809 male (63%) patients, with a mean age at treatment of 54.5 years.
Observed CAR-T product costs frequently exceeded the list price (i.e., WAC), and other events associated with the episode added further costs. As shown in Figure 1, the average WAC price across the CAR-T therapies was approximately $443,600 (as of July 1, 2023), but the mean CAR-T product allowed costs reached $616,500, representing an additional $172,900 in allowed costs beyond the average WAC. When including all costs for the episode (the 60 days before through 60 days after index), the total increased to an average of $809,800—an additional $193,300.
Figure 1: Average WAC, average allowed costs for CAR-T therapy, and average allowed costs for 60-day episode
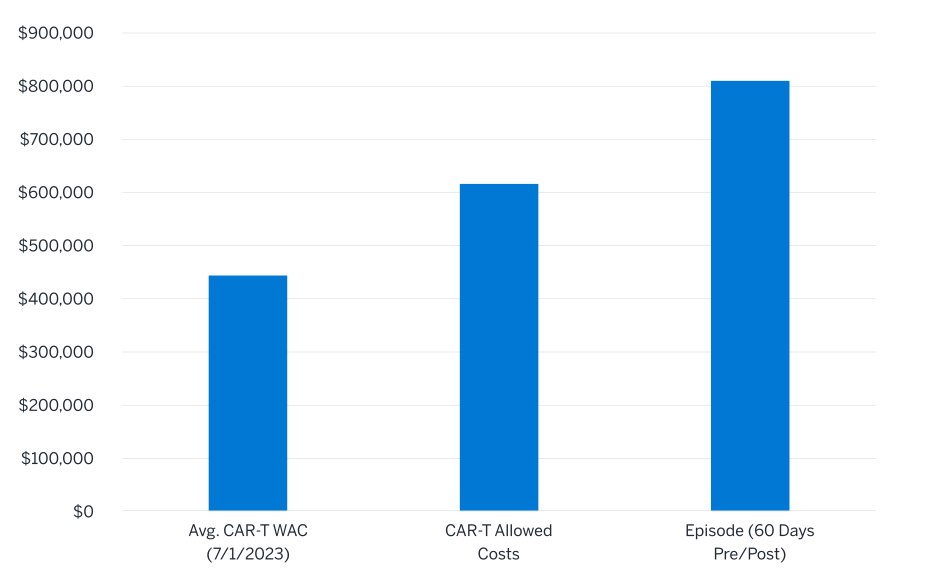
Footnote: The WAC above reflects a date near the midpoint of the study period. The “CAR-T Allowed Costs” column reflects 863 claims for which CAR-T-specific costs could be identified with reasonable certainty. The “Episode (60 Days Pre/Post)” column is inclusive of the CAR-T allowed costs.
The CAR-T product costs reflected a wide range of reimbursement amounts, with some claims having substantial markups relative to their WAC. Figure 2 presents the portion of cases exceeding WAC by a multiplier. We observed 24% were at least 1.5 times WAC, 15% were at least 2 times WAC, and 5% were at least 3 times WAC. For context, three times the average WAC was approximately $1.3 million, yet we observed 1 in 20 cases where the CAR-T product allowed costs were at or above this amount.
Figure 2: CAR-T product costs: Portion of cases where allowed costs exceed wac by 1.5 times, 2 times, and 3 times
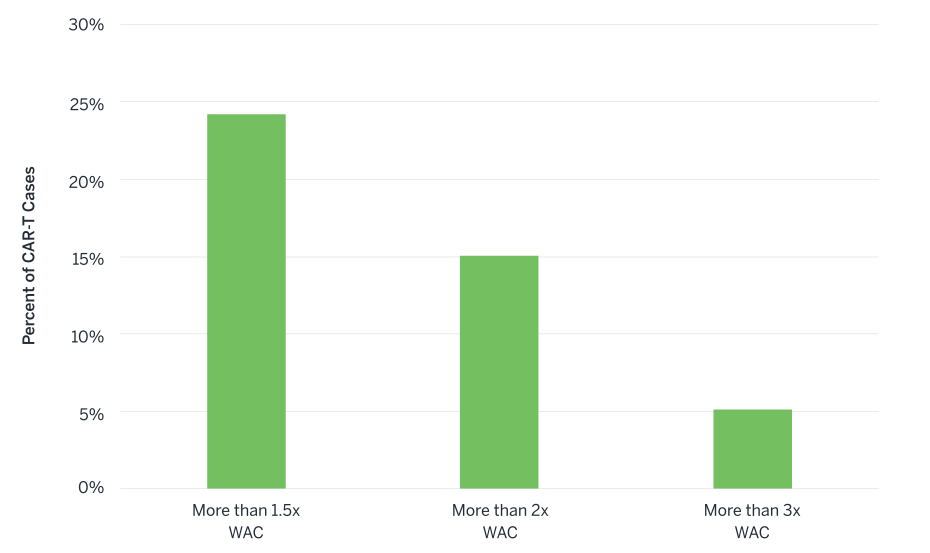
Footnote: Reflects 863 claims where the CAR-T-specific costs could be identified with reasonable certainty. Comparison to WAC was calculated on a claim-level basis to account for changes in WAC. Columns are not mutually exclusive (e.g., the “more than 2x” is also in the “more than 1.5x” since the threshold is met).
We also observed that CAR-T product costs varied between outpatient and inpatient settings. Figure 3 presents the CAR-T product costs associated with site of care. Approximately 70% of CAR-T claims were coded as inpatient claims (as an International Classification of Diseases, 10th Revision, Procedure Coding System [ICD-10-PCS] code), and the remaining CAR-T cases were captured under a Healthcare Common Procedure Coding System (HCPCS) code, which is typically associated with an outpatient setting. Inpatient cases had an average CAR-T product cost of $645,900, while HCPCS (outpatient) cases had an average cost of $554,500—a difference of $90,000.
Figure 3: Average CAR-T product costs by claim type (site-of-care)
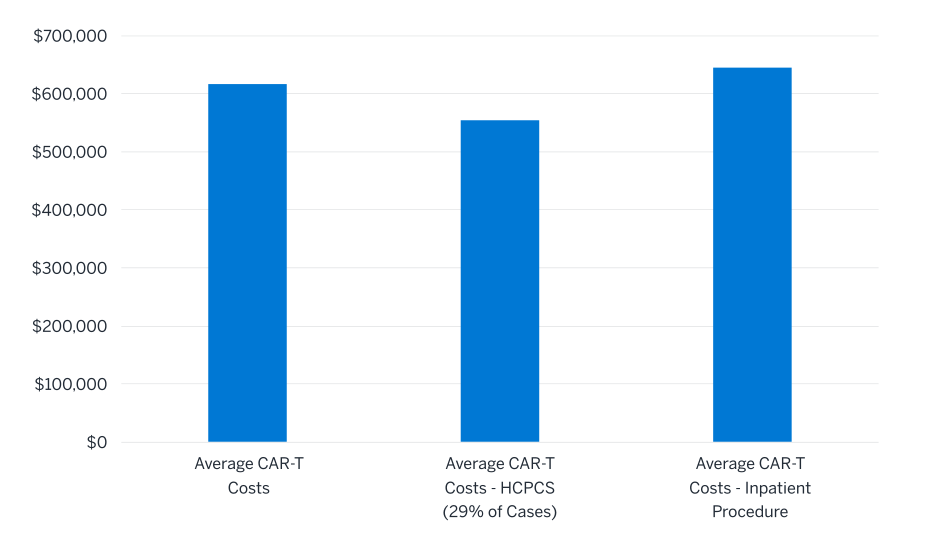
Footnote: Reflects 863 claims where the CAR-T-specific costs could be identified with reasonable certainty.
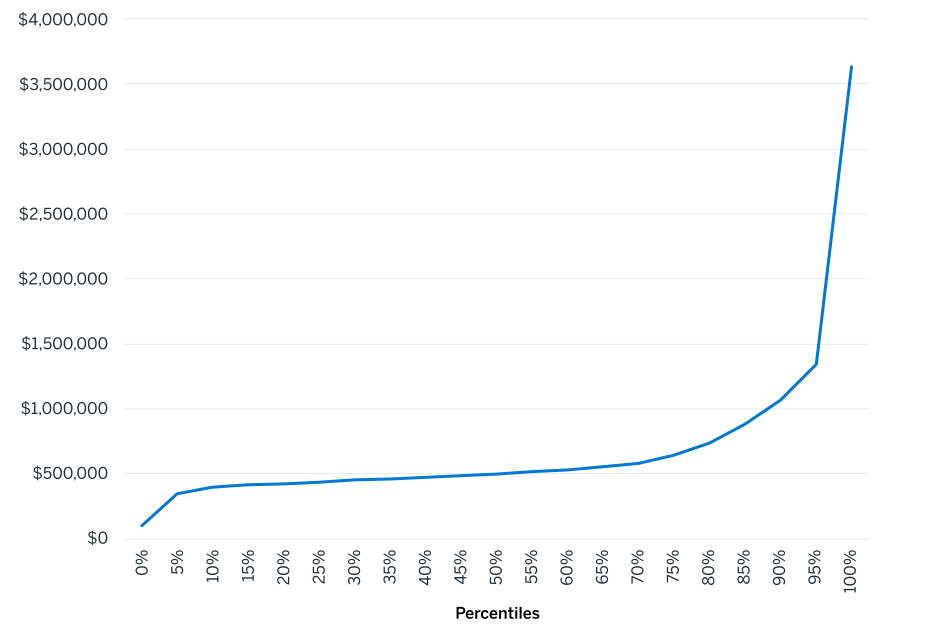
Furthermore, the financial impact of CAR-T therapy also extends beyond the day of administration. Figure 4 shows the distribution of episode-of-care costs for the 60 days before through 60 days after the index date, including the cost of the CAR-T treatment itself. There was a fairly steady increase from around the 10th percentile to the 80th percentile, then a steep increase was observed for the highest percentiles. The 50th percentile (median) was $694,500; comparatively, 15% of cases had episode costs exceeding $1.1 million (i.e., the 85th percentile).
When including the 60 days before through 60 days after treatment, 15% of CAR-T cases exceeded $1.1 million
The top high-cost cases were driven by the cost of the CAR-T product itself rather than the other nonproduct costs associated with the episode. For the top 15% of cases (where episode costs exceeded $1.1 million), the CAR-T product cost captured approximately 90% of the total 60-day episode costs, whereas the bottom 15% of cases (for which episode costs were below $562,400) reflected the CAR-T product capturing approximately 75% of the episode costs. All other costs during the 60-day episode primarily were associated with inpatient charges, stratified as 57% inpatient facility, 33% outpatient facility, and 10% professional charges.
Figure 4: Total episode costs by percentile (60 days before through 60 days after treatment, including cost of the CAR-T therapy)
Discussion
Although WAC provides a useful benchmark for treatment pricing, we observed that allowed costs for the CAR-T product and total episode varied considerably across cases, with 15% of cases exceeding $1.1 million.
In this analysis, many CAR-T claims were observed with costs several times higher than WAC. The highest-cost cases were driven by the CAR-T product itself. Markups on physician-administered drugs are common in inpatient and outpatient settings4,5 and are often calculated as a multiplier of a pricing benchmark. However, for high-cost specialty drugs such as CAR-T therapies, using default reimbursement methods can result in much higher cost exposure for payers. Commercial payers should be cognizant of this financial risk and take proactive steps to mitigate the risk of an unexpected markup. These may include reassessing prior authorization protocols and requiring treatment at sites with contracted, standardized treatment costs or bundled pricing.
Beyond the reimbursement for the treatment itself, expenses surrounding the episode contributed a notable amount of costs, adding nearly $200,000 on average when including the 60 days before through 60 days after treatment. These costs are also variable, dependent on site of care (inpatient versus outpatient), length of stay, complications, or adverse events. Each of these events collectively produces variability in the episode costs for a given treated patient. Viewed through this lens, two patients can receive the same CAR-T product and generate vastly different levels of spending depending on where treatment is delivered, the mark-up on the CAR-T therapy, how costs are managed (contracting), and what degree of pre- and post-treatment care is incurred.
WAC is only a starting point for understanding real-world CAR-T cost exposure; treatment cost markups and episode-related care can materially increase payer spend
In summary, these findings suggest that CAR-T should be evaluated not simply as a high-cost drug, but more as a high-cost care pathway with economics that are heavily influenced by provider-specific practices, site-of-care decisions, and post-treatment resource utilization. As additional cell and gene therapies enter the market, understanding these sources of variation may become increasingly important for forecasting costs, designing reimbursement models, and managing financial risk.
Key takeaways for commercial payers
This analysis of commercial claims data highlights how CAR-T therapy and episode costs vary and where financial exposure may emerge for payers. Observed CAR-T product costs frequently exceeded WAC, while the ancillary costs associated with the episode added materially to payer exposure. In this analysis, mean CAR-T product allowed costs reached $616,500, with mean 60-day episode costs (including the cost of the drug) of $809,800. Costs also varied substantially across cases. At the episode level, 15% of cases exceeded $1.1 million.
For insurers and other risk-bearing organizations, these findings suggest that CAR-T therapy should be evaluated as a high-cost episode of care, not just a high-cost therapy. Site of care, therapy markup, reimbursement approach, and post-treatment resource use may all shape financial exposure and should be considered in forecasting and reimbursement strategy.
Limitations
Limitations include the use of administrative claims and allowed cost data, which may be affected by coding accuracy, incomplete clinical detail, and differences in payer contracts or reimbursement arrangements. The analysis was descriptive and not designed to identify causal drivers of cost variation. Costs were evaluated within 60 days after CAR-T administration and may not capture longer-term spending. Findings may not generalize to other populations, payer channels, or treatment settings.
In performing this analysis, we relied on publicly available research, Milliman Gene and Cell Therapy Forecasting, and Milliman’s CHSD. If the underlying data or information is inaccurate or incomplete, the results of our analysis may likewise be inaccurate or incomplete. We performed a limited review of the data used directly in our analysis for reasonableness and consistency and found no material defects in the data. If there are material defects in the data, it is possible that they would be uncovered by a detailed, systematic review and comparison of the data to search for questionable values or relationships that are materially inconsistent.
Guidelines issued by the American Academy of Actuaries require actuaries to include their professional qualifications in all actuarial communications. Jessica Naber is a member of the American Academy of Actuaries and meets the qualification standards for authoring this report.
1 Cordell, B. (2024, September 17). Complexities in forecasting eligible cases and associated costs of cell and gene therapy. Milliman. Retrieved June 26, 2026, from https://www.milliman.com/en/insight/complexities-forecasting-cases-costs-cell-and-gene-therapy.
2 Naber, J. (2024, November 1). Cell and gene therapies: Informing the uncertainties using research and retrospective claims analysis. Milliman. Retrieved June 26, 2026, from https://www.milliman.com/en/insight/cgt-uncertainties-retrospective-claims-analysis.
4 Robinson J.C., Whaley C., & Dhruva S.S. (2024, January 24). Hospital prices for physician-administered drugs for patients with private insurance. New England Journal of Medicine, 390(4), 338–345. Retrieved June 26, 2026, from doi:10.1056/NEJMsa2306609.
5 Silverman, E. (2021, January 20). How much? Hospitals mark up some medicines by 250% on average. STAT. Retrieved June 26, 2026. https://www.statnews.com/pharmalot/2021/01/20/hospitals-biosimilars-drug-prices/.