What is subsidence and why is it a concern for UK insurers?
Subsidence refers to the downward movement of the ground, often resulting in damage to buildings and infrastructure. Subsidence is a significant geotechnical concern in the UK, particularly in areas with certain soil types. The occurrence of subsidence can manifest as cracks in walls, uneven floors, and misaligned doors and windows, which can lead to complex and costly claims on both household insurance and commercial property insurance policies.
According to the ABI, payments made on subsidence-related insurance claims during the first half of 2025 totalled £153 million. This is due to an exceptionally warm and dry spring, which worsened soil moisture deficits in vulnerable regions and triggered an increase in subsidence-related damage.
What do we know about subsidence from previous years?
Many regions across the UK have clay-rich soils which expand when wet and shrink when dry. During prolonged droughts, clay soils lose moisture and contract, leading to ground movement and, in some cases, subsidence. When wet weather returns, the clay swells, which can cause further structural movement.
Historical data shows a spike in subsidence claims during and after hot, dry summers (e.g., 1976, 2003, 2018 and 2022). The 2018 heatwave, for example, led to a significant number of insurance claims for subsidence, particularly in areas with shrink-swell clay soils.
Subsidence events tend to peak in late summer and early autumn, following the driest and warmest months. An event, in this context, is intended to mean an accumulation of insurance claims driven by common conditions. This seasonal pattern is closely linked to the annual variations in soil moisture.
What do we expect in the future?
Climate projections suggest the UK will experience more frequent and intense periods of drought and heavy rainfall (summarised by the UK Met Office, and graphic shown in Figure 1, below). This is likely to increase the frequency and severity of subsidence events, especially in areas with susceptible soils.
Figure 1: Global warming and future high-impact weather in the UK by UK Met Office
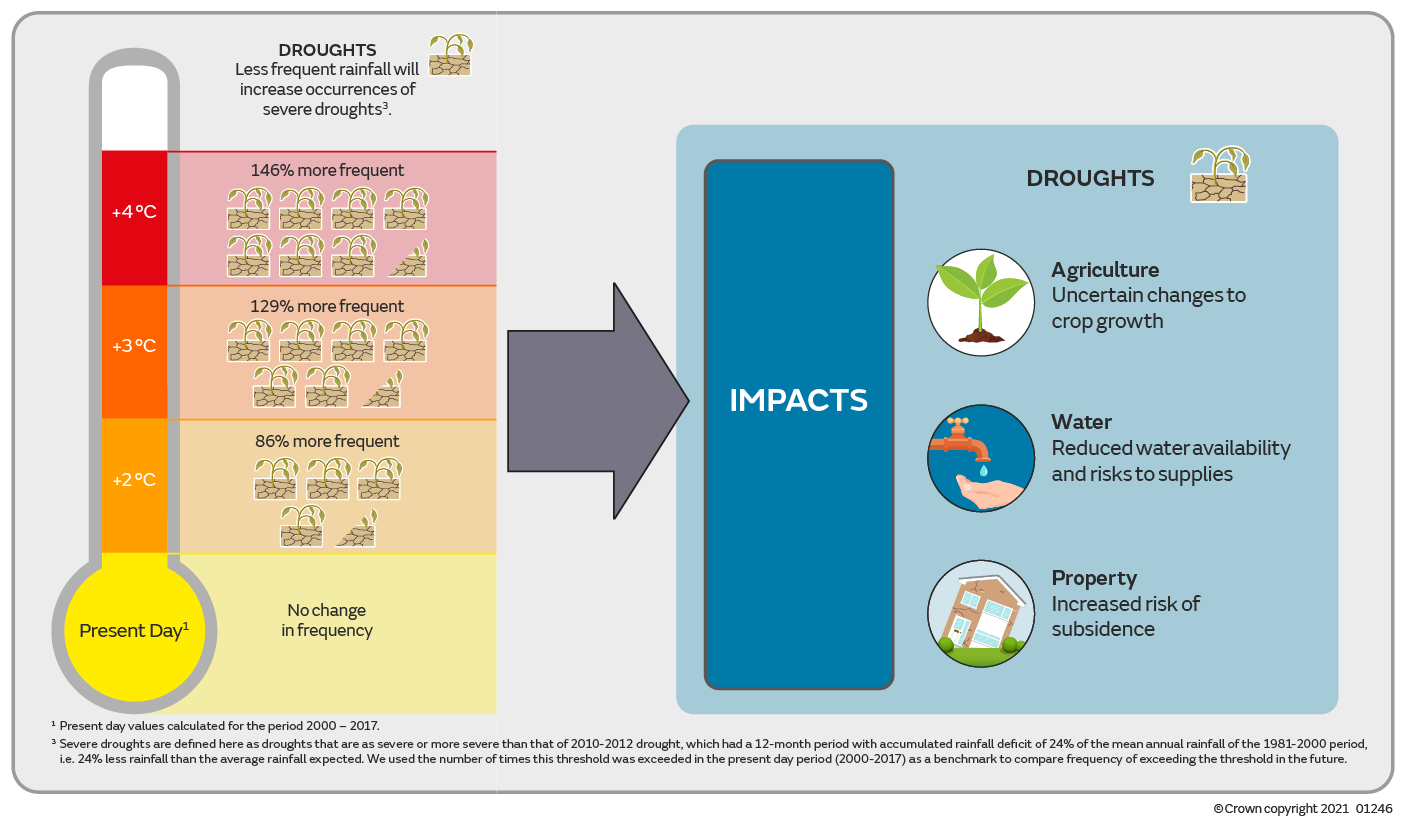
Source: UK Met Office at https://www.metoffice.gov.uk/research/climate/understanding-climate/uk-and-global-extreme-events-drought.
Advances in climate science and data analytics have improved the ability to predict subsidence events. The British Geological Survey and insurance companies use soil moisture monitoring, weather forecasts and historical claims data to model and predict subsidence risk. These tools help homeowners, planners and insurers understand potential vulnerabilities better.
Understanding subsidence likelihood using soil moisture deficit
Soil moisture deficit (SMD) is a key measure of the level of moisture in the ground, defined as the amount of water required to bring the soil back to its field capacity. It is calculated based on incoming daily rainfall, outgoing daily potential evapotranspiration and a fixed available water capacity.
SMD can be a useful leading indicator of the risk of subsidence claims. A high SMD value indicates dry soils (greater deficit, less moisture and potentially higher subsidence risk) while a low SMD value indicates wetter soils (smaller deficit, more moisture and potentially less subsidence risk). SMD is measured in millimeters (mm) and represents the depth of water needed per unit area:
- SMD less than 50: Soil is moist with little risk of drought.
- SMD between 50 and 100: Soil is drying with a moderate risk of drought.
- SMD greater than 100: Soil is very dry with a high risk of drought (and risk of subsidence in clay soils).
Monitoring SMD provides valuable insights for anticipating subsidence claims and helps planners, insurers and homeowners take timely preventive measures.
Conditions are ripe for a 2025 UK subsidence event
The summers of 2018 and 2022 saw significant increases in subsidence claims, attributed to extended hot and dry weather. Data from the Environment Agency’s August 2025 monthly water situation report regarding SMD levels show conditions in line with 2018 and 2022.
Figure 2 (below) shows SMD graphs for England and Wales the summers of 2018, 2022 and 2025, along with 2021 and 2023 to give context for non-subsidence event summers. In each case, graphs for end of July and end of August (typically the period of the year when claims emerge) indicate the regions which have SMD measurements that are particularly high (i.e. dry soil) and low (i.e. moist soil) and comparing both graphs from a year provides an indication of the directional movement in SMD. As indicated by the graphs, the 2025 SMD measurements resemble 2018 and 2022, indicating a similarly heightened risk for subsidence events. In contrast, the 2021 and 2023 measurements indicate lower SMD values on average, especially in London and the South East.
Figure 2: SMD maps from the Environment Agency’s august monthly water report for 2018, 2021, 2022, 2023 and 2025
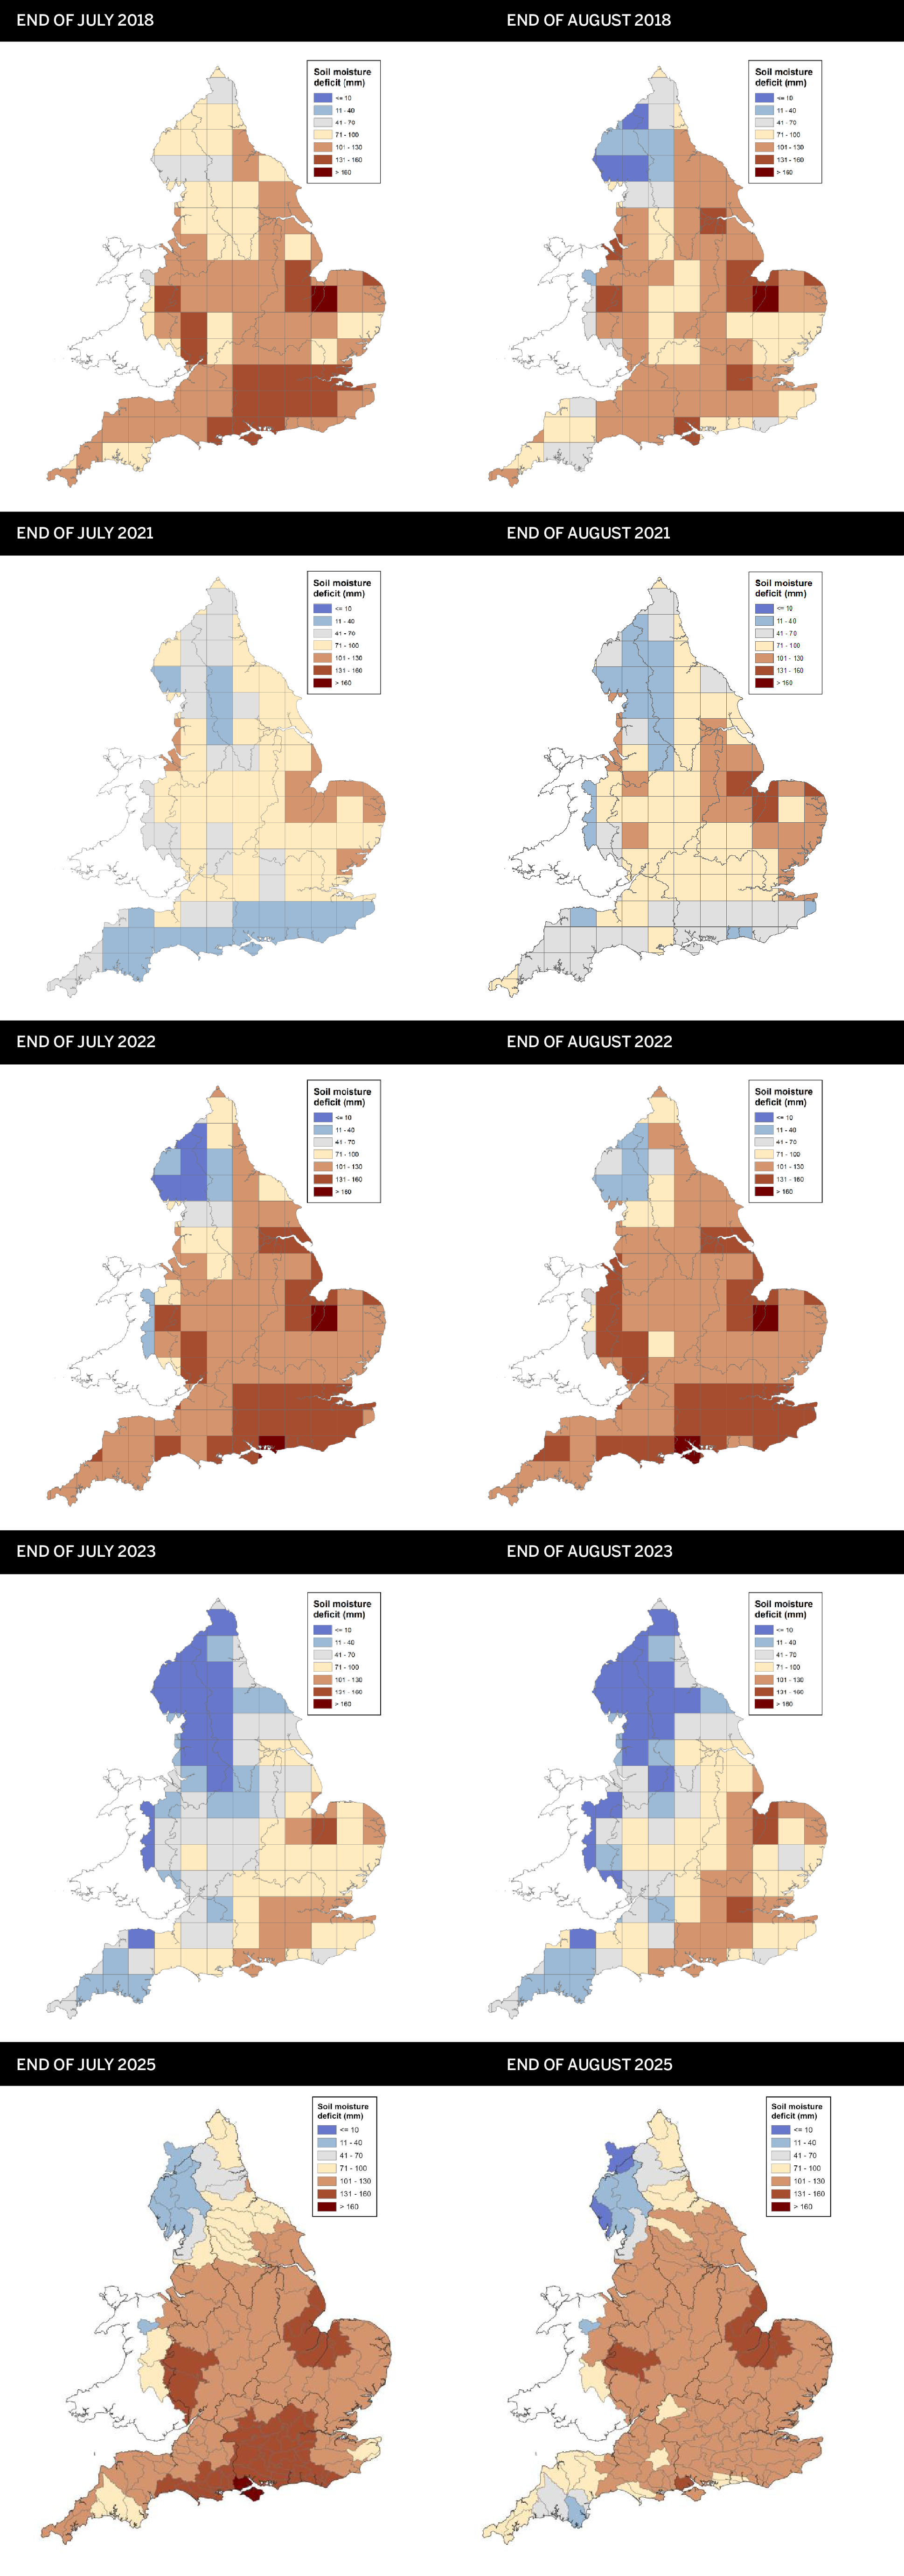
Source: Water Situation Report. GOV.UK (https://www.gov.uk/). 2018 report | 2021 report | 2022 report | 2023 report | 2025 report
A less scientific but potentially still informative measure of subsidence activity can be observed in Google Trends data showing web search activity for ‘subsidence’ since 2017. There is seasonal variation, typically showing spikes over the summer months. Clear spikes can be seen in August 2018 and August 2022, with an emerging spike in August 2025.
The Google Trends data is not a representation of actual subsidence claims (and the trends may be caused by increased reporting on subsidence in the press leading to more searches), but it does suggest there is heightened background interest in subsidence in 2025 at a level in line with earlier years impacted by subsidence claims.
Figure 3: Google Trends data showing searches for ‘subsidence,’ January 2017–October 2025

What can actuaries do about subsidence?
Reserving
Subsidence claims are known to take longer to emerge than other property losses, with true costs being difficult to assess until detailed structural work is performed. Further, ultimate claim settlements often end higher than initial estimates. This could mean the extent of subsidence losses in the reported data as at quarter- and year-end valuation dates for respective reserving reviews is not a robust representation of the ultimate loss. Claim count development patterns derived using data from known event years can be useful in projecting losses to ultimate by means of the frequency-severity method. Ultimate severity can be estimated by considering inflation-uplifted severities from known event years, market statistics and input from the claims function.
Companies with more granular claims data may find it useful to dig deeper. Some areas which could benefit from additional investigation include:
- For organisations which subscribe to the ABI’s Domestic Subsidence/Heave/Landslip “Change of Insurer” Claims Agreement, policy inception dates for new policyholders can be relevant.
- Claims where underpinning has been determined by engineers to be the best remedy are historically the most expensive as it is the most invasive, expensive and time-consuming treatment for subsidence.
- For claims where tree roots are a suspected cause, ownership of the tree determines responsibility for the damage. If the relevant trees are owned by a local authority, settlement may be very slow.
Pricing
Pricing models should be fed geospatial data on subsidence claims history to ensure high risk areas in the claims data are captured. Our clients overlay this with external data such as soil type, land use and building type to enhance understanding of subsidence risk, which adds value through improved risk selection and improved price precision. Whether or not complex modeling is undertaken, regular monitoring of exposure to high-risk subsidence areas should be performed to ensure concentration of risk is managed.
The frequency of hot dry years is expected to increase. Pricing models should be updated to incorporate a long-term base cost that reflects the expected claim frequency trend arising from this change.
Conclusion: A subsidence event during 2025 looks likely
The SMD levels as of July and August 2025 appear in line with previous high subsidence event years, suggesting that there is likely to be a further increase in the frequency of subsidence claims during the latter half of 2025, especially in traditional hot spots such as London and the South East.
There are sources of data and approaches available to actuaries to ensure that the extent of subsidence losses are well-understood by their organisations. Proactive use of these sources and methods supports robust reserving and pricing decisions in the face of this peril.