A 45-year-old construction worker suffers a back strain that requires more than 24 visits for physical therapy, several radiology tests, and a no-surgery decision but a recurring prescription for painkillers. Eventually the injury is judged to be a permanent disability. Several individual characteristics about this workplace injury could raise a red flag with a workers' compensation claim adjuster—including the injured worker’s demographics (45 years old, construction worker, back strain), medical experience (large number of physical therapy treatments, use of painkillers), or indemnity status (permanent disability). From this myriad set of factors, how can we efficiently determine which factors are most important for cost drivers, claims adjusting, case management, utilization review, and claim settlement, and what weight should be given to the different factors? Was the large number of physical therapy visits important for the no-surgery decision? Could the permanent disability determination have been made sooner (and possibly shortened the temporary disability period)?
Milliman has been working with new statistical tools that enable testing a much larger number of model specifications in a much shorter turnaround time than the conventional multivariate analyses (such as multiple analysis of variance, multiple regression, or GLM analyses). These analytical tools are particularly useful when using detailed medical data on workers' compensation claims (such as the number of physical therapy visits and the number of radiology treatments). The tools can include claims where data are not available for all characteristics and characteristics where data are not available for all claims (the pernicious “incomplete” and “missing” data problems). The analytical tools use machine learning, a type of artificial intelligence, to analyze hundreds of characteristics and correlations.1
Why the interest in a new analytical approach?
Data on individual claims are becoming available for an ever-increasing number of characteristics. We are accustomed to having data on the usual worker demographics and medical costs evaluated at a particular point in time. But insurers, self-insured employers, third-party administrators (TPAs), and medical bill reviewers are capturing an increasing amount of detailed (line-item) medical experience. Furthermore, the medical experience is not limited to professional services and hospital treatments but also includes pharmaceutical products and medical devices. The diversity of experiences across states and the availability of detailed medical data are providing the opportunity to arrange the medical experience into thousands of combinations of medical services, numbers of visits, and numbers of services. An important product from the analytical tools is the stratification of claims into low-cost to high-cost segments. An illustration of the claim segmentation is provided below.
There are several business reasons for the new analytical tools to be of interest to insurance payors. First, the new tools provide a means to more efficiently evaluate the multi-faceted characteristics of workers' compensation claims 30, 60, 180, 360, or any number of days after the date of the accident. Second, the segmentation process provides an efficient means to triage claims, where the most seasoned adjusters and medical case managers can be assigned to claims identified as high-cost claims. Third, the analytical process makes it easier to identify outliers, and particularly outliers that may not necessarily have extraordinary costs but are outliers when compared to other claims with similar characteristics. And fourth, the claim segmentation results may identify circumstances where a business process might be changed to lower claim costs.
Expanding the scope of data in predictive analytics
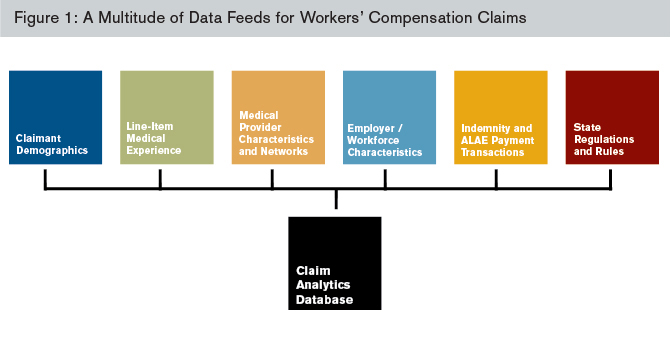
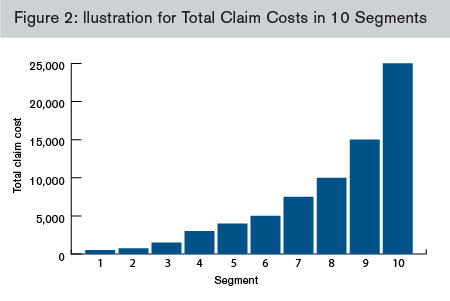
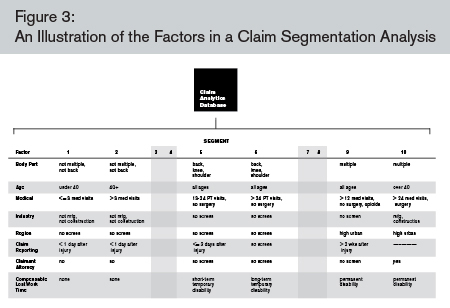
The power of these new analytical tools lies in their ability to efficiently identify factors that segment claims into different size-of-claim cost groups. Figures 1, 2, and 3 provide an illustration of how the myriad of potential segmentation factors might be used to sort claims into claim-cost groups. Figure 1 identifies the many different types of factors that can be included in the analysis. Figure 2 illustrates one pattern for the claim costs across the claim-cost segments. Figure 3 presents the factors that might describe the 10 claim-cost segments, with Segment 1 describing the types of claims with the lowest costs and Segment 10 describing the types of claims in the highest-cost group.
At the outset, the timing of the information will be important and useful for the analysis. The greatest power from the new analytical approach can be achieved by using transactional data—in particular, payment data where we can identify the date of payment, the covered period (for indemnity benefits), and the dates of service (for medical treatments). With transactional data, we can accumulate data based on the amount of time since an accident. This allows us to analyze the factors that are important as of (for example) 30, 60, 180, or 360 days from the date of accident.
New data can now be captured, enabling new ways to segment claims into different claim-cost groups. Figure 1 presents the varied types of data we can collect on workers' compensation claims. Although these data may not reside on a single system, we are able to link these data across systems.
- Demographic characteristics include the injured body part and the nature of the injury, the timeliness of reporting the injury, and the presence of an attorney, as well as the age, sex, and marital status of the injured worker. These characteristics may also include comorbidities that have implications on the injured worker’s recovery and return to work.2
- Line-item medical experience captures treatment-specific information for each medical service received by an injured worker. These medical services include treatments provided by medical professionals; laboratories, hospitals, and clinics; and pharmaceutical products (e.g., prescription drugs, prosthetics). For each medical treatment, we can capture the diagnosis (e.g., ICD-9 or ICD-10), type of service (e.g., CPT4, Health Care Procedure Coding System, Revenue Code, National Drug Code), date of service, amount paid, amount charged, type of provider, and whether the medical treatment was provided in a network.
- Medical provider characteristics and networks identify the type of medical professional (e.g., physician, surgeon, physical therapist, chiropractor) and whether the service was provided within a network.
- Employer/workforce characteristics include the occupation, job tenure, and industry of employment.
- Indemnity and allocated loss adjustment expense (ALAE) payment transactions capture the amount and dates of payment for indemnity benefits and allocated loss adjustment expenses (e.g., legal expenses, independent medical exams, cost containment expenses).
- State regulations and rules concern the factors that distinguish the workers' compensation systems across states, with special attention to state rules and regulations pertaining to medical fee schedules, the ability to direct care, utilization review, and treatment guidelines.3

A more efficient process for identifying cost drivers in predictive analytics
With this increasing complexity of data, it is imperative to use analytical tools that are powerful and flexible enough to consider a multitude of cost drivers. For some claims, we may not have complete information for some characteristics. For example, we may be missing medical treatments for claims with bundled payments, lump sum settlements, or out-of-state treatments. We may also be missing certain demographic characteristics. Nevertheless, claims with “missing data” can be included in the analytical process. Furthermore, under conventional multivariate processes, it may take a considerable amount of time and effort to identify those factors that provide the strongest relationships in an analysis of claim costs.
Milliman has been working with software tools that have the flexibility to overcome problems with missing or incomplete data. These tools permit testing hundreds of model specifications in a short time period. As a result, using these alternative analytical tools, all possible combinations of all potential segmentation factors are tested.
The analytical tools identify the factors that work to group claims according to a predetermined outcome—such as the total claim cost.4 Figure 2 presents an illustrative result where the predetermined objective was to create 10 segments according to total claim costs.5 In this illustration, Segments 1, 2, and 3 capture the claims with the lowest claim costs, which may be claims with a small number of medical treatments and no compensable lost work time. Segments 4 and 5 describe claims with slightly higher but still modest claim costs, and Segments 6, 7, and 8 identify types of claims with higher claim costs. Finally, Segments 9 and 10 capture claims with the highest claim costs.

For each segment, there will be a set of characteristics that describe the claims. Figure 3 lists some characteristics that could have been identified during the segmentation process summarized in Figure 2. In Figure 3 (click to enlarge), Segment 1 is the lowest-cost segment, where injured workers are characterized as not having multiple injuries or a back injury, under 40 years old, with fewer than three medical visits, not working in manufacturing or construction, in any geographic location, reported within one day of the accident, and without an attorney. Segment 5—a group with claim costs near the middle—includes injured workers with a back, knee, or shoulder injury, 13-24 physical therapy (PT) visits but no surgery, and reported in three or fewer days after the accident. Finally, Segment 10—the group with the highest-cost claims—captures claims with these characteristics: multiple injuries, more than 24 medical visits, had surgery, and represented by an attorney.

Several variations can be performed for the analyses described in Figures 2 and 3. First, the analyses can be performed for different experience periods—such as for 30, 60, 180, or 360 days after the date of the accident. Second, the results can be used to identify outliers—both within the claim population used for the analysis as well as for claims outside the analysis. For example, claims fitting the characteristics for Segment 5 but with Segment 10 costs should be flagged for an outlier investigation. Third, the analyses can be performed for different subgroups of a payor’s claim population—for example, for certain states or books of business. Similarly, the analyses may be performed for claims in a select program (such as treated in a best-practices medical network, which used treatment guidelines, or which was part of a utilization review program) and then the balance of the claim population tested for differences from the selected program.
This discussion has been intended to illustrate the results from a new analytical approach that can efficiently process data from a large workers' compensation claim database with a large and diverse set of characteristics. As described above, there are several business reasons for payors to be interested in this new process, including the ability to efficiently perform time-from-accident analyses, efficient claim triage, outlier identification, and the opportunity to identify business processes that may be changed.
Finally, returning to our 45-year-old construction worker, it would appear that his claim would have fallen into Segment 9 in our illustration. We would first check to see whether this claim was an outlier among the Segment 9 claims (particularly in terms of claim costs). We could then check whether the permanent disability determination was made in a timely manner, and then check whether a change in the claim or medical management might have avoided the permanent-disability result. In the end, this analytical process provides a means to more efficiently identify those factors associated with high-cost claims and to develop business and operational strategies to focus on the high-cost claims.
1 According to Wikipedia, “Machine learning, a branch of artificial intelligence, is a scientific discipline concerned with the design of algorithms that take as input empirical data, such as that from sensors or databases, and yield patterns and predictions though to be features of the underlying mechanism that generated the data. … A major focus of machine learning research is the design of algorithms that recognize complex patterns and make intelligent decisions based on input data.” Retrieved September 26, 2012, from http://en.wikipedia.org/wiki/Machine_learning.
2 In the present context, a comorbidity is a condition that might cause the need for more medical care or a longer disability period for a given injury. These conditions might include obesity, smoking, or diabetes.
3 Tanabe 2011 and 2012 summarize the differences in state workers compensation laws and regulations, including medical cost containment programs. See Fomenko and Liu 2012, and Yang and Fomenko 2012, for recent studies on medical fee schedules and the medical prices for workers' compensation claims. See Yee, Borba, and Coomer 2011 for a study on the impact of preauthorization, and Borba and Yee 2012 for a study on the impact of treatment guidelines.
4 Other outcome measures could include total indemnity benefits, total medical costs, or a component of the medical experience (such as the number of visits for physical therapy).
5 It must be kept in mind that Figures 2 and 3 are illustrations. While the factors are generally consistent with low- to high-cost segments observed in workers' compensation claim data, the presentations in Figures 2 and 3 are not based on any single analysis and should not be used to draw conclusions.
References
Borba, P. & Yee, C. (2012). Impact of Treatment Guidelines in Texas. Workers Compensation Research Institute: Cambridge, MA. WC-12-23, September 2012.
Fomenko, O. & Liu, T.C. (2012). Designing Workers’ Compensation Medical Fee Schedules. Workers Compensation Research Institute: Cambridge, MA. WC-12-19, June 2012.
Tanabe, R. (2011). Workers’ Compensation Medical Cost Containment: A National Inventory, 2011. Workers Compensation Research Institute: Cambridge, MA. WC-11-35, April 2011.
Tanabe, R. (2012). Workers’ Compensation Laws as of January 2012. Workers Compensation Research Institute: Cambridge, MA. WC-12-18, March 2012.
Yang, R. & Fomenko, O. (2012). WCRI Medical Price Index for Workers’ Compensation, Fourth Edition (MPI-WC). Workers Compensation Research Institute: Cambridge, MA. WC-12-20, March 2012.
Yee, C., P. Borba, & Coomer, N. (2011). Impact of Preauthorization of Medical Care in Texas. Workers Compensation Research Institute: Cambridge, MA. WC-11-34, June 2011.